States With the Longest Coffee Orders
Coffee has become more than a morning necessity. It’s a ritual.
For some, that ritual is as simple as ordering a black coffee. For others, it’s a string of add-ins, modifications, and seasonal flavors that can turn a quick request into something much more complicated.
To see how those habits play out across the country, we surveyed more than 2,300 Americans about their go-to coffee orders and preferences. We analyzed not only the length of their orders but also how often they buy coffee out, what flavors they reach for, and how men and women differ in their choices.
The results reveal which states keep it short, which ones take their time at the counter, and the trends that define how Americans enjoy their daily cup.
Which U.S. States Have the Longest Coffee Orders?
Coffee orders are getting longer, and in some states, they’re bordering on elaborate. A quick cup of coffee can easily turn into a list of modifications that slows the line for everyone else.
To see what these variable orders actually look like, our survey asked more than 2,300 people to finish the phrase “May I please have a …” and then analyzed exactly how many words each person used. We cleaned up the responses, counted the words, and broke down the results by state of residence to find out what parts of the country are holding up the coffee shop checkout line the most.
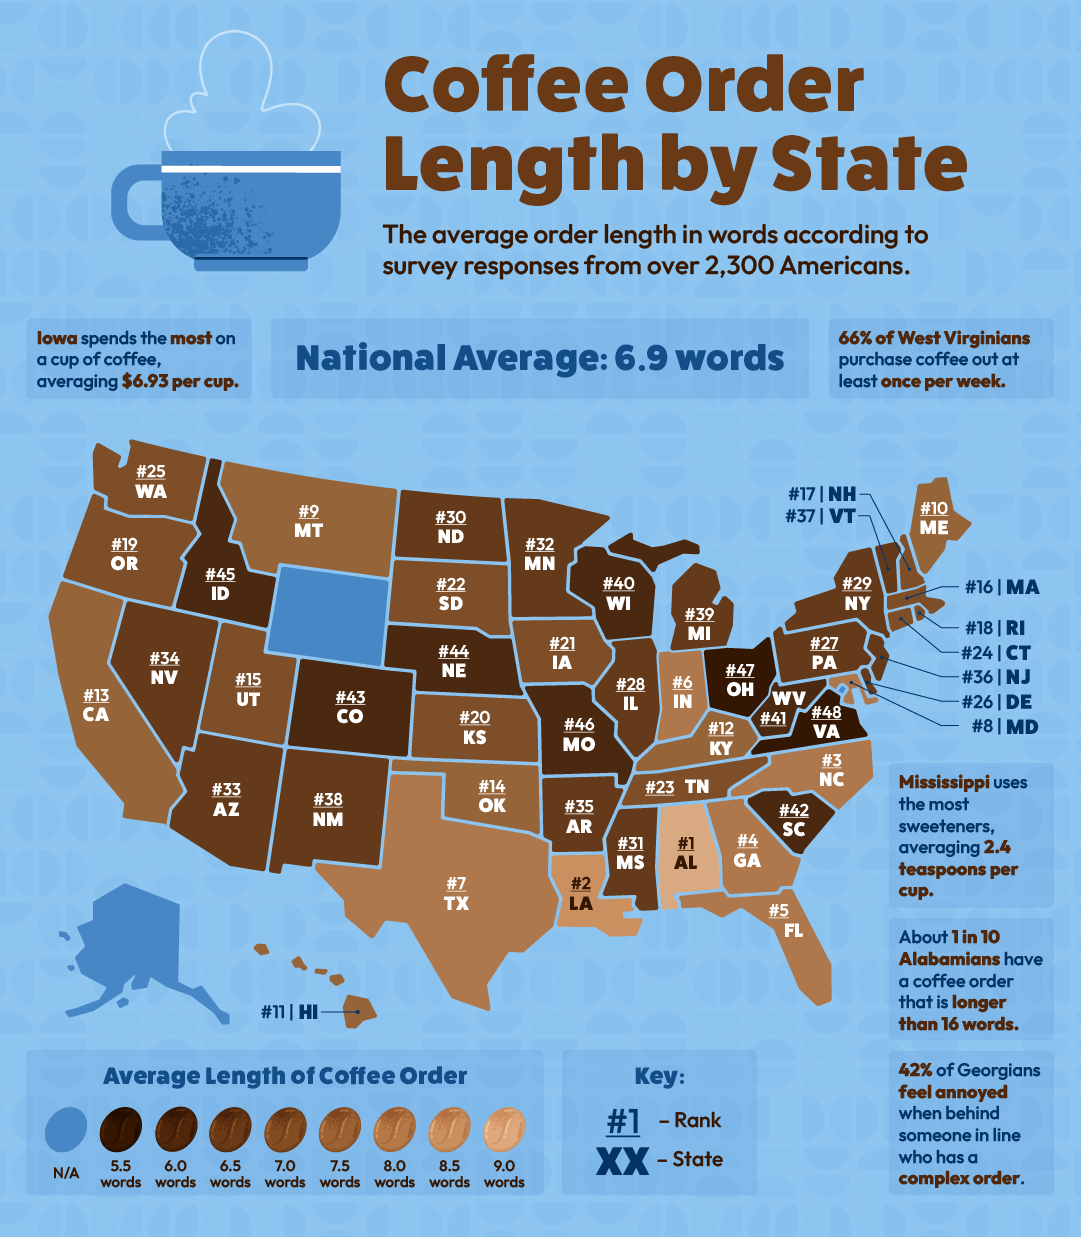
On average, Americans use 6.9 words to place a coffee order. That may not sound like much, but once you move past the drink name, every extra word usually signals some sort of modification. Multiply those modifications by a full line of customers, and suddenly the morning rush feels anything but quick.
Here’s what stood out:
States with the longest coffee orders:
- Alabama – 8.8 words
- Louisiana – 8.3
- North Carolina – 8.2
- Georgia – 8.2
- Florida – 8.1
Alabama tops the list and is home to the longest coffee orders in the country with nearly 9 words per order. When we dig a little deeper, we see that nearly 1 in 10 residents (9%) stretch their order into 16 words or more (six times the national average of 2.6%).
States with the shortest coffee orders:
- Virginia – 5.4 words
- Ohio – 5.7
- Missouri – 5.9
- Colorado – 6.1
- Nebraska – 6.1
On the other end of the spectrum, Virginia stands out for having both the shortest average order (just 5.4 words) and the fewest long orders. Only 14% of Virginians go beyond seven words when ordering their coffee, compared to the national average of 36%.
The way that we order is just part of the equation when it comes to how Americans consume coffee. That’s why we asked all about coffee shop habits and preferences
Here are some other regional coffee takeaways:
How often people buy coffee out:
- West Virginia leads, with 66% purchasing coffee out at least once per week.
- New Mexico trails at 28%.
- The national average is 45%.
Residents of West Virginia may keep orders relatively short (6.2 words), but they’re showing up to the counter more often than any other state.
Coffee costs:
- Iowa pays the most, averaging $6.93 per order.
- Ohio spends the least, at $4.99.
- Across all states, the average cost is $5.97.
Coffee costs also change by generation. Gen Z spends about $6.40, millennials $6.15, Gen X $5.80, and baby boomers $5.00. Whether from discounts or simpler preferences, older generations pay less for their cup.
How people feel about complex orders:
- Georgia says they’re annoyed by it most often, at 42%.
- Louisiana is the least annoyed at 16%.
- The average across all states is 28%.
It’s interesting that Georgians report being so irritated by complex coffee orders considering their own orders rank among the longest. It seems as though the call is coming from inside the house. Louisiana’s tolerance makes a little more, since residents there are also known for lengthy orders.
Sweetener use:
- Mississippi stirs in the most, with 2.4 teaspoons on average.
- Illinois adds the least at 1 teaspoon.
- The national average is 1.5 teaspoons.
Three other states average more than two teaspoons of sweetener for their coffee: North Carolina, Alabama, and Georgia use about 2.1, on average. This clustering in the Southeast continues the trend of regionalized coffee preferences we’ve seen so far.
Who drinks drip coffee:
- Oregon residents drink it most often (87%).
- Arkansas drinks it the least (61%).
- Nationally, 73% of respondents said they drink it.
Drip coffee is especially popular in the West, with both Colorado (86%) and Arizona (85%) reporting high rates of consumption, along with Oregon. The preference for simple drip coffee stands in contrast to the elaborate orders found elsewhere.
The results show how something as routine as ordering coffee varies widely across the country. Some states keep it short while others heavily customize, revealing how tastes and preferences change nationwide. Next, we’ll look closer at what Americans are actually ordering, and how those preferences differ from state to state.
How Do Americans Take Their Coffee?
Coffee may be universal, but how Americans actually drink it varies widely. From the length of their orders to the add-ins they can’t go without, preferences split sharply depending on who’s in line.
Order length and customization
- The average coffee order in the U.S. is just under 7 words.
- Women’s orders run longer at 7.5 words, compared to 6 for men.
- Customization matters more to women, who rated its importance at 7.1 out of 10, compared to just 5.5 for men.
What goes into the cup
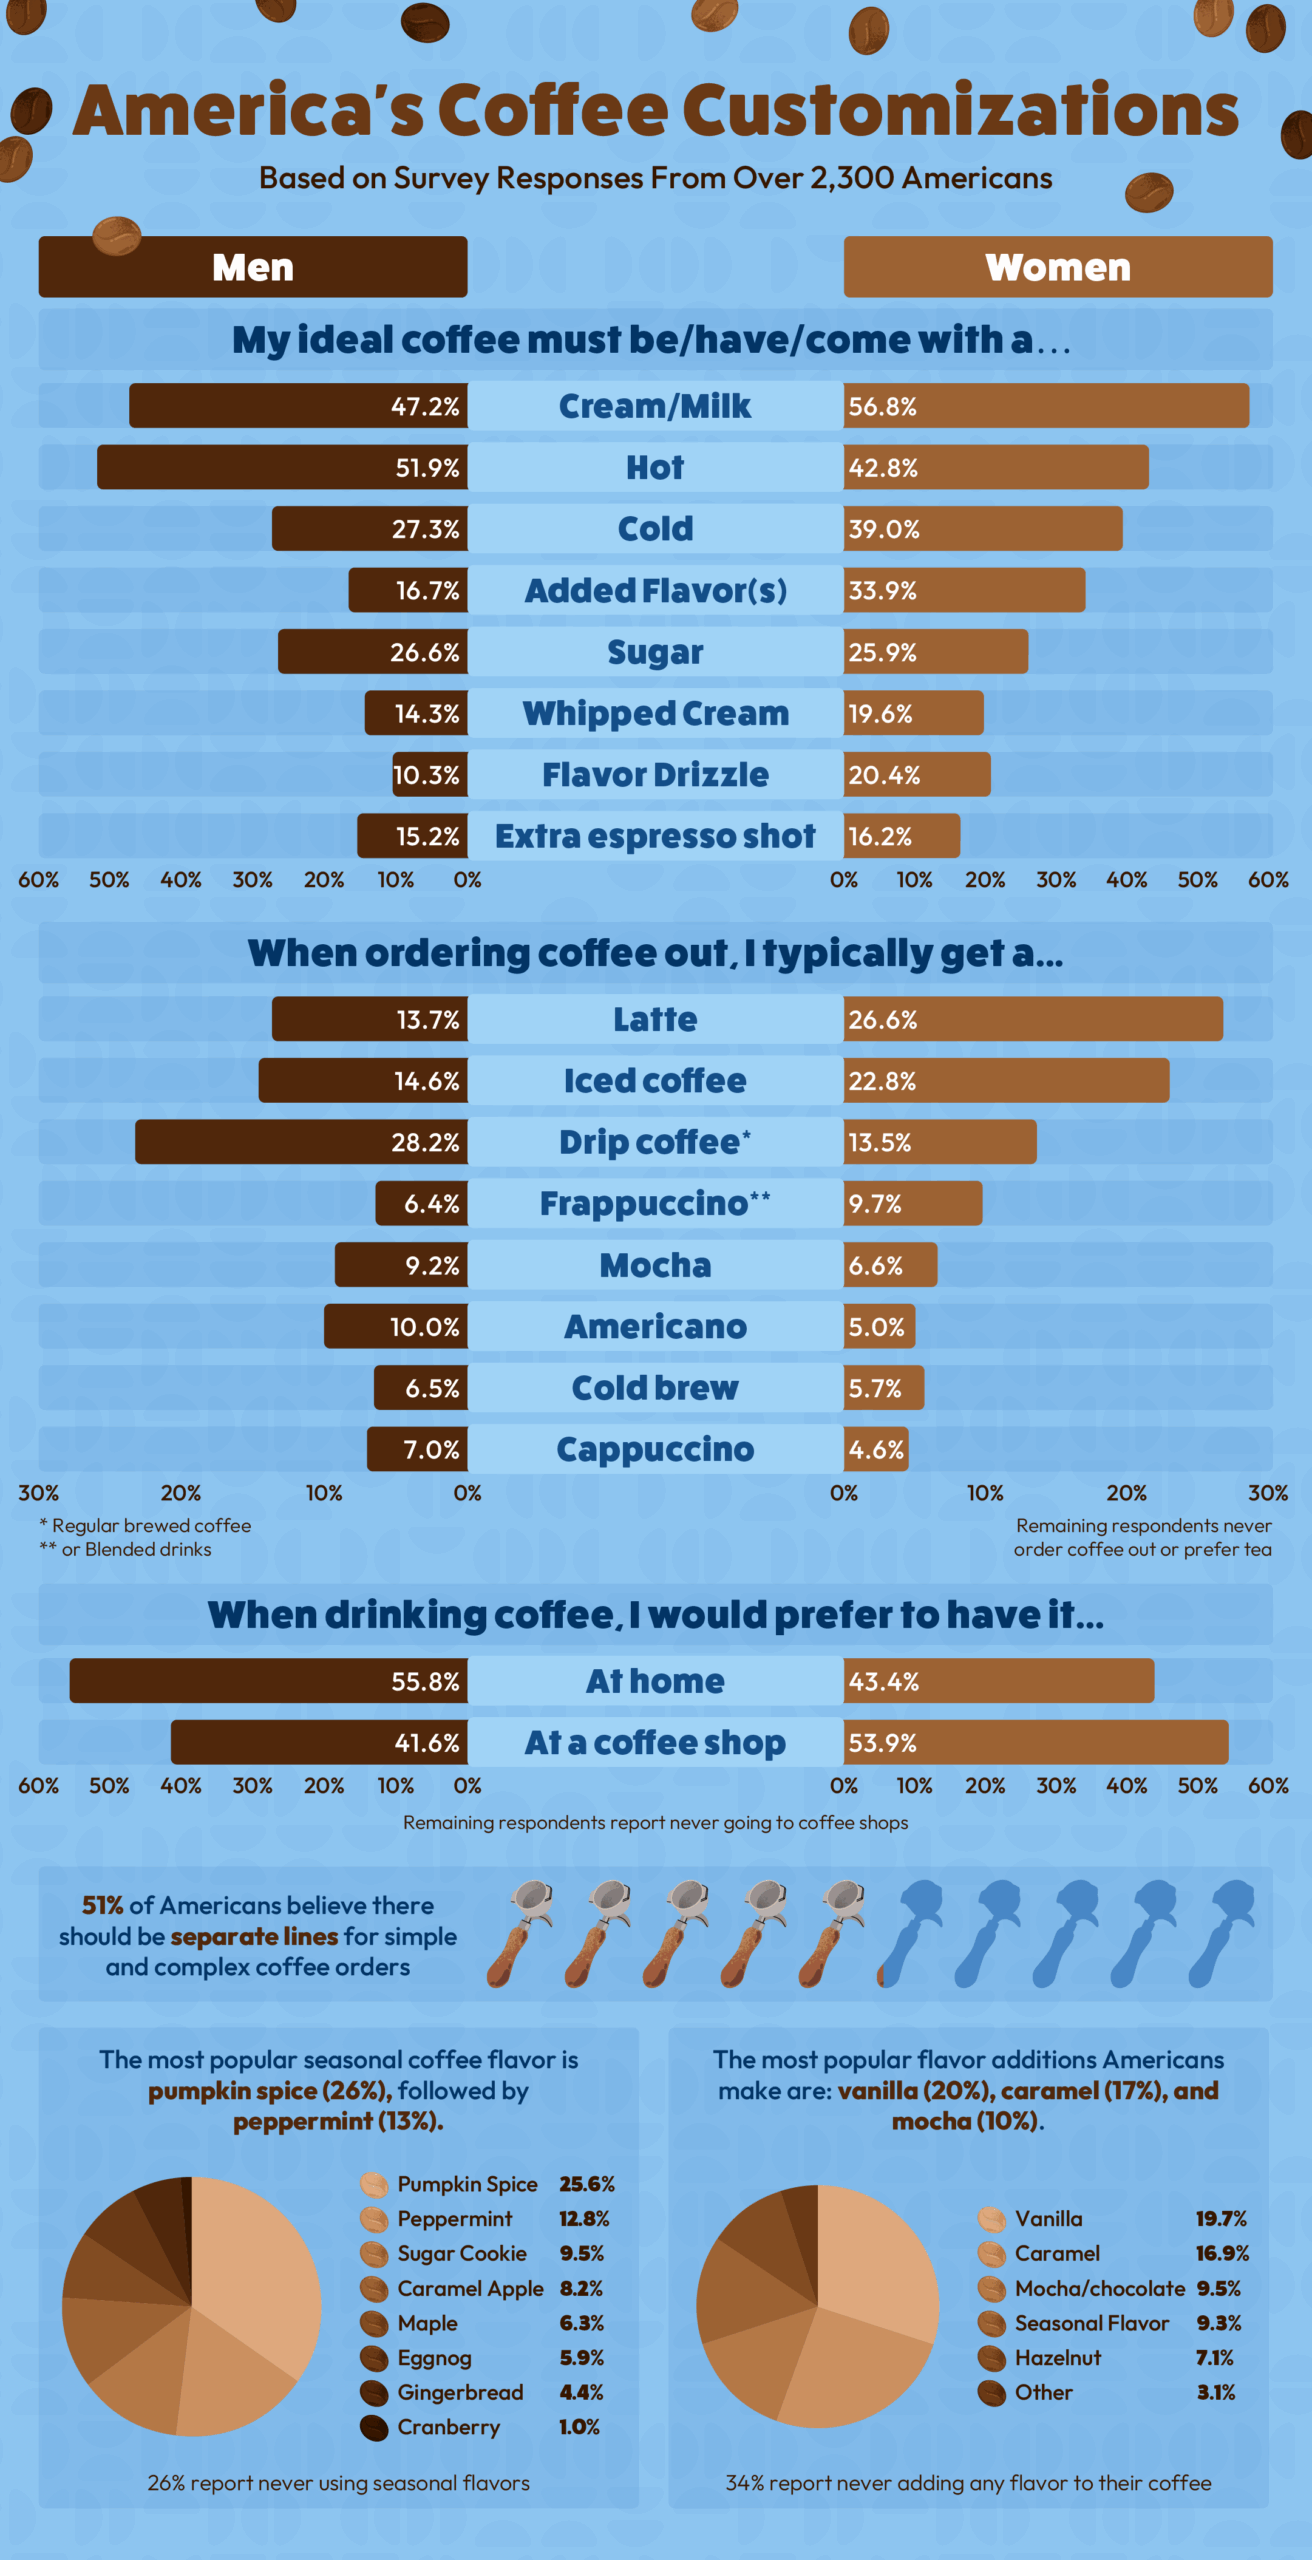
- More than half of coffee drinkers (53%) say their ideal cup must include cream or milk, making it the most popular add-in by far.
- Women are twice as likely as men to want added flavors (34% vs. 17%).
- Vanilla (20%), caramel (17%), and mocha/chocolate (10%) lead the way when it comes to flavor preferences.
- About one in three Americans (34%) don’t add any flavor at all, sticking to a simpler cup.
Hot vs. cold coffee
- Men are more likely to say their coffee has to be hot (52%), while women lean more toward cold (39% compared to 27% of men).
- Younger adults drive the cold trend: 52% of those ages 18-28 prefer iced coffee, compared to only 13% of people 61 and older.
Most popular coffee shop orders
- Lattes lead nationally, with 21% naming them their go-to drink.
- Iced coffee follows at 20%, just ahead of classic drip coffee at 19%.
- Men are more than twice as likely as women to order drip coffee (28% vs. 13%).
- Women show a stronger preference for lattes (27% vs. 14% of men).
Coffee shop culture
- Americans are almost evenly split on whether coffee shops should offer separate lines for simple versus complex orders (51% in favor, 49% opposed).
- Men lean toward the idea of separate lines more than women (57% vs. 48%).
- That split mirrors the gender differences in order length. Men might prefer a shorter wait, while women place more value on customizing their drinks.
At home vs. coffee shop
- Coffee drinkers divide almost evenly between preferring coffee shops (49%) and making coffee at home (48%).
- Women lean toward coffee shops (54% vs. 42% of men).
- Men prefer making coffee at home (56% vs. 43% of women).
Seasonal favorites
- Pumpkin spice tops the list of seasonal flavors at 26%.
- Peppermint follows at 13%, then sugar cookie at 9%.
- Pumpkin spice’s dominance continues, but nearly a third of Americans avoid seasonal flavors altogether.
From order length to flavor preferences, Americans are far from uniform in how they take their coffee. Gender and generational differences shape not only what ends up in the cup but also how much time is spent ordering it. Whether keeping it simple at home or crafting a seasonal latte at the counter, the data shows that coffee habits are as diverse as the people drinking it.
Methodology
To determine the states with the longest coffee orders and get insight into how preferences differ by state and demographically, we surveyed over 2,300 Americans over two weeks in September 2025.
The ranking of coffee order length was based on survey responses telling us exactly what they say when ordering a cup of coffee by finishing this sentence: “May I please have a …” We cleaned up responses and found the number of words each respondent uses when ordering. We broke that data down by state, age, and gender to see who has the longest and shortest coffee orders.
States not included due to insufficient survey respondents: Alaska and Wyoming.
Closing Thoughts
Americans may share a love for coffee, but the way they order and drink it couldn’t be more different. Our study showed which states stretch their orders into near-monologues, which ones keep it short, and how gender and age shape everything from flavors to hot or iced preferences.
These differences highlight how something as routine as a morning coffee reflects broader habits and personalities across the country. Some people value efficiency, others customization, and many are split right down the middle.
At Surety First, we understand the same is true in construction. Every project comes with its own complexities, expectations, and details that need to be managed. Just as baristas keep lines moving despite long orders, we help contractors stay accountable so projects get done right.
HAVE BONDING QUESTIONS?
Call us today at 1-800-682-1552 to speak with a licensed contractors bond specialist.
Mon-Fri 8:30am-5:00pm
Or